Table — Milk production in four countries, 1990, 2000 and 2010
📄 Bài mẫu band 8–9
| Introduction | Paraphrase: bảng ghi sản lượng sữa hằng năm (triệu lít) của Netherlands, Australia, Tanzania, Guatemala vào 1990, 2000 và 2010. |
| Overview | Overall: Netherlands và Australia vượt xa hai nước còn lại ở cả ba năm; sản lượng cuối kỳ cao hơn đầu kỳ ở cả bốn nước, Guatemala tăng nhanh nhất theo tỉ lệ. Không số liệu. |
| Body 1 | Netherlands: 11.240 → 11.090 → 11.520 triệu lít (tăng ròng dưới 3%). Australia: 6.480 → 10.950 (tăng khoảng 70%, chỉ kém Hà Lan 140 triệu lít năm 2000) → 9.210. |
| Body 2 | Tanzania: 92 → 138 (tăng đúng một nửa) → 161. Guatemala: 31 → 47 → 88 (gần gấp đôi trong thập kỷ sau, gần gấp ba so với 1990). Năm 2010 Netherlands vẫn gấp hơn 70 lần Tanzania. |
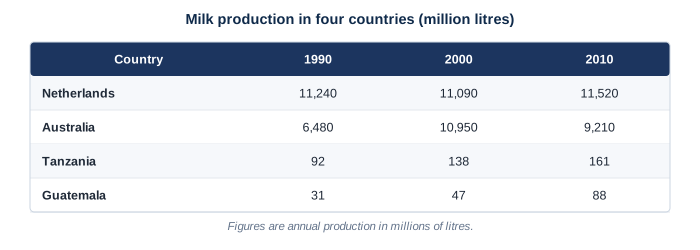
The table records how much milk, in millions of litres, the Netherlands, Australia, Tanzania and Guatemala produced annually in 1990, 2000 and 2010.
Overall, the Netherlands and Australia dwarfed the other two countries as milk producers in all three years. Output was nonetheless higher at the end of the period than at the beginning in every country, with Guatemala, the smallest producer, growing fastest in proportional terms.
The Netherlands led throughout, and its output remained remarkably stable: after a slight dip from 11,240 to 11,090 million litres in 2000, it recovered to 11,520 million in 2010, a net gain of under 3%. Australia was far more volatile. Its production soared by roughly 70%, from 6,480 to 10,950 million litres, coming within 140 million litres of the Dutch figure in 2000, but then fell back to 9,210 million by 2010.
Tanzania and Guatemala produced milk on an entirely different scale. Tanzanian output rose by exactly half in the first decade, from 92 to 138 million litres, and reached 161 million in 2010. Guatemala produced just 31 million litres in 1990 and 47 million in 2000, before its output almost doubled to 88 million, nearly three times the 1990 level. Even so, the Netherlands was still producing over 70 times as much milk as Tanzania in 2010.
| dwarfed the other two | vượt xa, làm hai nước kia trở nên nhỏ bé |
| in proportional terms | xét theo tỉ lệ |
| remained remarkably stable | giữ ổn định một cách đáng chú ý |
| a slight dip | một đợt giảm nhẹ |
| coming within | tiến sát tới, chỉ còn cách |
| on an entirely different scale | ở một quy mô hoàn toàn khác |
| almost doubled | tăng gần gấp đôi |