Table — Household composition in a North American country, 1970 and 2003
📄 Bài mẫu band 8–9
| Introduction | Paraphrase: bảng chia hộ gia đình ở một nước Bắc Mỹ thành sáu kiểu, cho tỉ lệ năm 1970 và 2003 cùng tổng số hộ (triệu). |
| Overview | Overall: hộ vợ chồng, nhất là có con, chiếm tỉ trọng nhỏ hơn hẳn (nói tỉ trọng, không nói số hộ giảm); bốn kiểu hộ còn lại, nhất là người sống một mình, đều tăng tỉ trọng; tổng số hộ tăng mạnh. Không số liệu. |
| Body 1 | Married couples with children 40.3% → 23.3% (giảm đúng 17 điểm); without children 30.3% → 28.2%, lên thành kiểu phổ biến nhất; gộp hai kiểu: khoảng bảy phần mười → hơn một nửa (70.6% → 51.5%). |
| Body 2 | Men living alone 5.6% → 11.2% (gấp đôi); Women living alone 11.5% → 15.2%; Other family 10.6% → 16.4%; Other non-family 1.7% → 5.7% (hơn gấp ba). Tổng số hộ 63.4 → 111.3 triệu (tăng khoảng ba phần tư). |
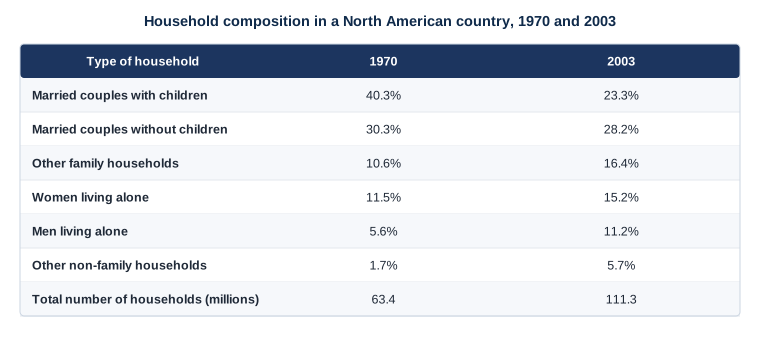
The table breaks down households in a North American country into six types, giving the percentage each represented in 1970 and 2003 alongside the total number of households in millions.
Overall, married couples, above all those with children, formed a far smaller proportion of households by the end of the period, while all the other types, particularly people living alone, accounted for a larger share. The total number of households also grew substantially.
Married couples with children made up 40.3% of households in 1970, the largest share, but only 23.3% in 2003, a fall of exactly 17 percentage points. Couples without children slipped only slightly, from 30.3% to 28.2%, and consequently became the most common household type. Even so, married couples as a whole declined from roughly seven in ten households to just over half.
All four remaining categories expanded. The proportion of men living alone doubled from 5.6% to 11.2%, narrowing the gap with women living alone, whose figure rose from 11.5% to 15.2%. Other family households increased from 10.6% to 16.4%, and other non-family households, though still the smallest group, more than tripled from 1.7% to 5.7%. Meanwhile, the overall number of households climbed from 63.4 million to 111.3 million, an increase of about three-quarters.
| accounted for a larger share | chiếm tỉ trọng lớn hơn |
| a fall of exactly 17 percentage points | mức giảm đúng 17 điểm phần trăm |
| slipped only slightly | chỉ giảm nhẹ |
| the most common household type | kiểu hộ gia đình phổ biến nhất |
| as a whole | tính gộp chung |
| narrowing the gap with | thu hẹp khoảng cách với |
| more than tripled | tăng hơn gấp ba |
| about three-quarters | khoảng ba phần tư |