Pie charts — Proportion of time spent on different office tasks, 1980 and 2006
📄 Bài mẫu band 8–9
| Introduction | Paraphrase: cách nhân viên văn phòng ở một nước chia thời gian làm việc cho sáu loại công việc, năm 1980 và 2006. |
| Overview | Overall: việc trên máy tính và email từ chỗ không đáng kể thành việc tốn thời gian nhất; các việc truyền thống (giấy tờ, điện thoại, viết thư) đều chiếm ít thời gian hơn hẳn. Không số liệu. |
| Body 1 | 1980: Paperwork 34%, Phone calls 22%, Writing letters 15% (không gọi là hạng ba vì Meetings 18% cao hơn). 2006: 11% (chưa bằng một phần ba), 13%, 3%. Cộng ba việc: 71% → 27%. |
| Body 2 | Computer and email 4% → 41% (khoảng gấp mười), gần gấp đôi Meetings (18% → 21%); Other 7% → 11%, ngang Paperwork năm 2006. |
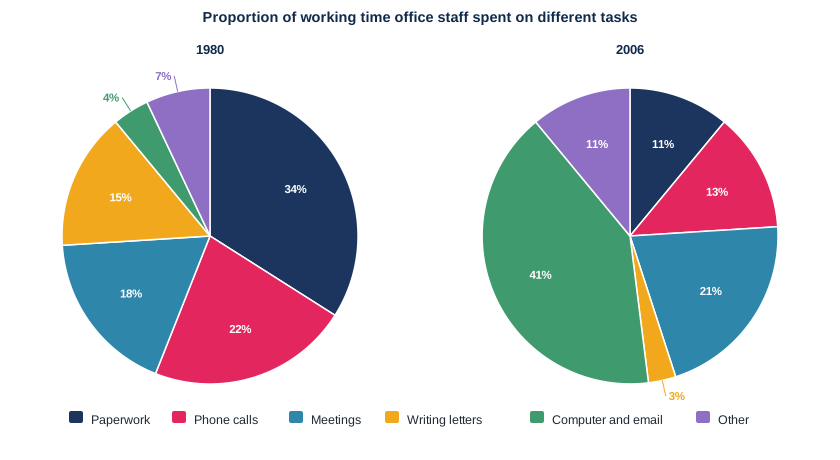
The two pie charts compare the way office workers in one country divided their working hours among six kinds of task in 1980 and in 2006.
Overall, computer and email work went from being a marginal activity to the single most time-consuming one. At the same time, traditional tasks such as paperwork, phone calls and letter writing all took up a much smaller share of the working day.
In 1980, paperwork was the dominant task, accounting for 34% of staff time, while phone calls claimed 22% and writing letters a further 15%. By 2006 all three had contracted: paperwork to 11%, less than a third of its earlier share, phone calls to 13% and letter writing to a mere 3%. Taken together, these activities shrank from 71% of the working day to just 27%.
The time freed up was absorbed chiefly by computer and email work, which occupied only 4% of working time in 1980 but 41% in 2006, a roughly tenfold increase. This made it almost twice as large as the next biggest category, meetings, whose share edged up from 18% to 21%. Other tasks also rose modestly, from 7% to 11%, putting them level with paperwork in the later year.
| the single most time-consuming | tốn nhiều thời gian nhất (hơn hẳn mọi việc khác) |
| took up a much smaller share | chiếm tỉ trọng nhỏ hơn nhiều |
| the dominant task | công việc chiếm ưu thế |
| a mere 3% | vỏn vẹn 3% |
| Taken together | gộp lại |
| a roughly tenfold increase | mức tăng khoảng mười lần |
| edged up | nhích lên |
| putting them level with | đưa chúng lên ngang với |