Mixed charts — Average income by industry, 2000 and 2010
📄 Bài mẫu band 8–9
| Introduction | Paraphrase: bar chart so thu nhập bình quân năm ở sáu ngành năm 2000 và 2010; bảng ghi số lao động từng ngành trong hai năm đó. |
| Overview | Overall: lương tăng ở năm trên sáu ngành, IT và Finance bỏ xa; IT cũng mở rộng lao động nhanh nhất; Manufacturing là ngành duy nhất giảm người, Retail lương thấp nhất. Không số liệu. |
| Body 1 | 2000: Finance $46,500, IT $41,800. 2010: IT $71,400 (tăng khoảng 70%), vượt Finance $68,200. Construction 30,200 → 38,900; Education 31,400 → 36,700; Manufacturing 33,600 → 35,100; Retail 21,700 → 20,900 (chưa bằng một phần ba IT). |
| Body 2 | IT 185,000 → 540,000 (gần gấp ba); Manufacturing 1.32 triệu → 960,000 (mất 360,000); Finance, Education, Construction tăng 45,000–70,000; chốt: Retail 980,000 → 1.15 triệu, thành ngành đông nhất dù lương thấp nhất. |
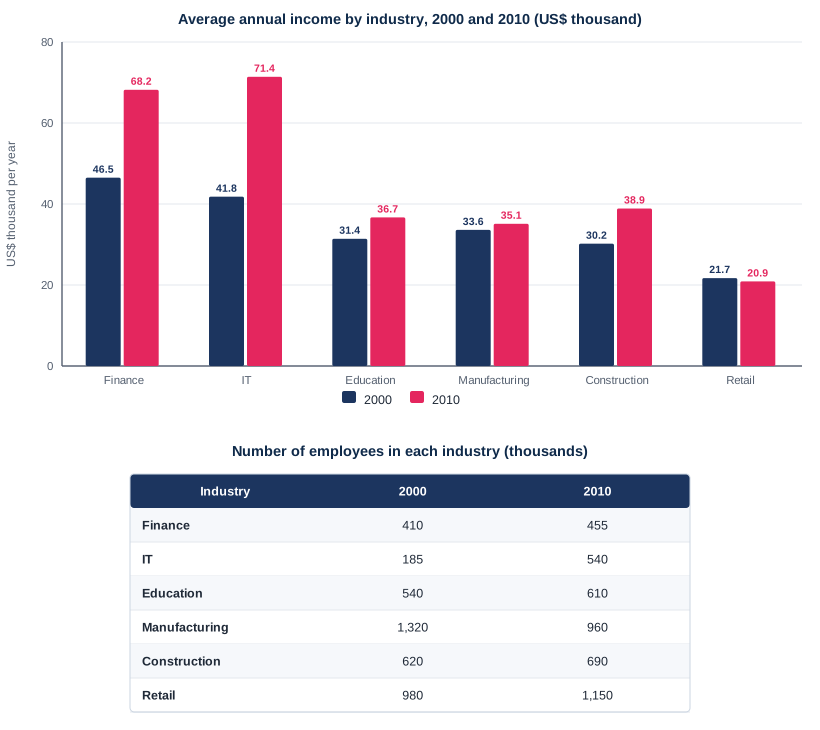
The bar chart compares average yearly earnings in six industries in one country in 2000 and 2010, and the table records how many people each industry employed in those years.
Overall, pay rose in five of the six industries, with IT and finance far outstripping the rest, and IT also expanded its workforce much faster than any other sector. Manufacturing was the only industry to shed staff, while retail remained the lowest-paid.
In 2000, finance workers earned the most, at $46,500 a year, ahead of IT on $41,800. By 2010 IT had leapt to $71,400, a rise of about 70%, and overtaken finance ($68,200). Gains elsewhere were far smaller: construction went from $30,200 to $38,900 and education from $31,400 to $36,700, while manufacturing barely moved ($33,600 to $35,100). Retail was the sole sector in which pay fell, slipping from $21,700 to $20,900, less than a third of the IT figure.
Employment followed a partly similar pattern. The IT workforce almost tripled, from 185,000 to 540,000, whereas manufacturing lost 360,000 jobs, falling from 1.32 million to 960,000. Finance, education and construction each grew only slightly, by between 45,000 and 70,000 employees. Retail, meanwhile, expanded from 980,000 to 1.15 million and so became the largest employer, despite being the worst paid.
| far outstripping the rest | bỏ xa các ngành còn lại |
| shed staff | cắt giảm nhân sự |
| overtaken finance | vượt qua ngành tài chính |
| barely moved | gần như không nhúc nhích |
| less than a third of | chưa bằng một phần ba của |
| almost tripled | tăng gần gấp ba |
| the largest employer | ngành sử dụng nhiều lao động nhất |