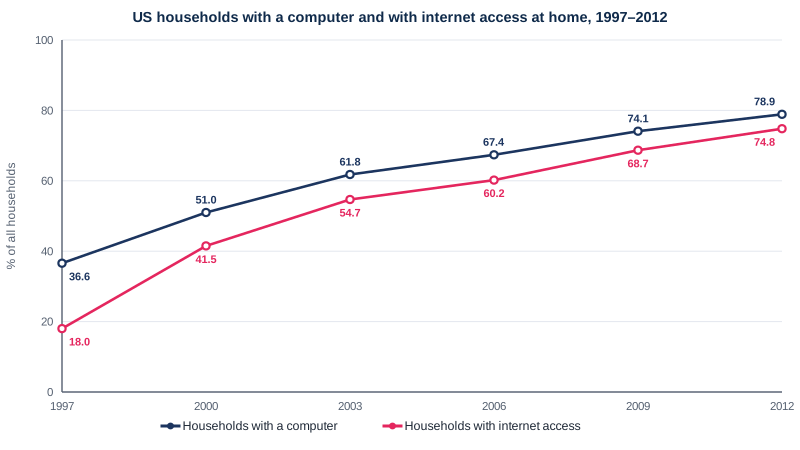
Line graph — US households with a computer and internet access, 1997-2012
📄 Bài mẫu band 8–9
| Introduction | Paraphrase: tỉ lệ hộ gia đình Mỹ có máy tính và có internet tại nhà thay đổi thế nào trong giai đoạn 1997–2012. |
| Overview | Overall: cả hai tỉ lệ tăng liên tục suốt mười lăm năm, nhanh nhất ở những năm đầu; hộ có máy tính luôn nhiều hơn hộ có internet nhưng chênh lệch thu hẹp đáng kể. Không số liệu. |
| Body 1 | 1997: máy tính 36.6%, gấp khoảng hai lần internet 18.0%. 2000: 51.0% và 41.5%. 2003: 61.8% và 54.7% — internet tăng gấp ba sau sáu năm. |
| Body 2 | Máy tính 67.4% (2006), 74.1% (2009), 78.9% (2012, gần bốn phần năm số hộ); internet 60.2%, 68.7%, 74.8%; khoảng cách từ 18.6 điểm còn 4.1 điểm. |
The line graph shows how the share of American households that owned a computer, and the share that could go online at home, changed between 1997 and 2012.
Overall, both figures rose without interruption over the fifteen years, with the fastest growth coming in the early part of the period. Computer ownership was always more common than home internet access, but the difference between the two shrank considerably.
In 1997, 36.6% of households had a computer, roughly twice the proportion with an internet connection (18.0%). Three years later, computer ownership had reached 51.0%, while internet access had jumped to 41.5%. This rapid expansion continued until 2003, when the figures were 61.8% and 54.7% respectively, meaning that the share of homes online had tripled in six years.
After 2003, the pace of growth slowed. Computer ownership climbed steadily through 67.4% in 2006 and 74.1% in 2009 to 78.9% in 2012, or just under four in five households. Internet access followed a similar upward course, rising to 60.2%, 68.7% and finally 74.8%. As a result, the gap between the two, which had been 18.6 percentage points in 1997, had narrowed to just 4.1 points by the end of the period.
| rose without interruption | tăng liên tục, không lần nào gián đoạn |
| shrank considerably | thu hẹp đáng kể |
| tripled in six years | tăng gấp ba trong sáu năm |
| the pace of growth slowed | tốc độ tăng chậm lại |
| climbed steadily | tăng đều đặn |
| followed a similar upward course | đi theo một hướng tăng tương tự |
| had narrowed to | đã thu hẹp còn |