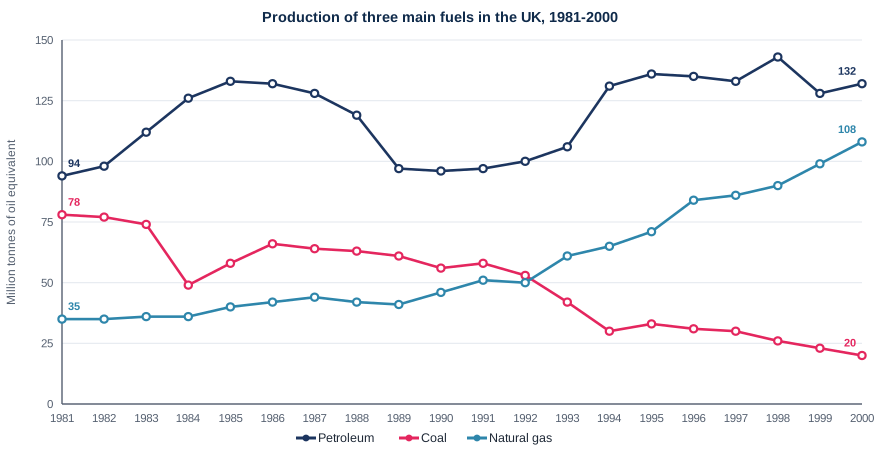
Line graph — Fuel production in the UK, 1981-2000
📄 Bài mẫu band 8–9
| Introduction | Paraphrase: sản lượng hằng năm của dầu mỏ, than và khí tự nhiên ở Anh trong hai thập kỷ từ 1981, đơn vị triệu tấn dầu quy đổi. |
| Overview | Overall: Petroleum luôn được sản xuất nhiều nhất dù dao động mạnh; Natural gas tăng mạnh còn Coal sụp giảm nên hai loại này đổi vị trí. Không số liệu. |
| Body 1 | Petroleum 94 (1981) → khoảng 133 (1985) → dưới 100 một chút (1989–1992) → khoảng 131 (1994) → đỉnh khoảng 143 (1998) → tụt nhẹ năm 1999 rồi kết thúc ở 132 (2000). |
| Body 2 | Coal 78 → dưới 50 (1984) → khoảng 66 (1986) → 20 (2000, còn khoảng một phần tư); Natural gas 35, đi ngang đến 1992 (khoảng 50), vượt Coal năm 1993, đạt 108 (gấp khoảng ba lần). |
The line graph plots the UK's annual output of petroleum, coal and natural gas, in millions of tonnes of oil equivalent, over the two decades from 1981.
Overall, petroleum was the most heavily produced fuel throughout, although its output fluctuated considerably. Natural gas production grew strongly while coal production collapsed, so that these two fuels exchanged positions.
Petroleum output rose rapidly from 94 million tonnes in 1981 to around 133 million in 1985, then fell back to just under 100 million by 1989 and stayed near that level until 1992. A second, sharper rise followed, taking production to about 131 million tonnes in 1994 and to a peak of roughly 143 million in 1998, before it dipped and finished the period at 132 million.
Coal began as the second largest source, at 78 million tonnes, but dropped abruptly to just under 50 million in 1984. Despite a partial recovery to around 66 million two years later, it then declined almost continuously to only 20 million in 2000, about a quarter of its original level. Natural gas moved in the opposite direction. Having risen only gradually from 35 to about 50 million tonnes by 1992, it overtook coal the following year and accelerated to 108 million by 2000, roughly three times the 1981 figure.
| fluctuated considerably | dao động đáng kể |
| fell back to | tụt trở lại mức |
| a peak of roughly | mức đỉnh khoảng |
| dropped abruptly | giảm đột ngột |
| declined almost continuously | giảm gần như liên tục |
| risen only gradually | chỉ tăng từ từ |
| overtook coal | vượt qua than |