Line graph — Fruit production in four countries, 1970-2010
📄 Bài mẫu band 8–9
| Introduction | Paraphrase: sản lượng trái cây (triệu tấn) của India, Brazil, USA, Italy theo từng mốc 10 năm, 1970–2010. |
| Overview | Overall: sản lượng tăng ở ba nước, ngoạn mục nhất là India, nước thành nhà sản xuất áp đảo; Italy giảm dần, từ đầu bảng xuống cuối bảng. Không số liệu. |
| Body 1 | 1970: India 13.1, Brazil 7.4. 1990: Brazil gần 30, nhỉnh hơn India khoảng 28, dẫn đầu cả bốn. Sau đó Brazil tăng chậm lại (khoảng 36 năm 2000, 38.9 năm 2010); India khoảng 43 (2000) rồi 71.8: hơn gấp năm mức 1970, gần gấp đôi Brazil. |
| Body 2 | USA 19.2 → khoảng 26 (1980, tạm dẫn đầu) → khoảng 24 → khoảng 30 (2000) → 26.7. Italy 25.3 (cao nhất 1970) giảm qua từng thập kỷ còn 18.3, khoảng một phần tư India. |
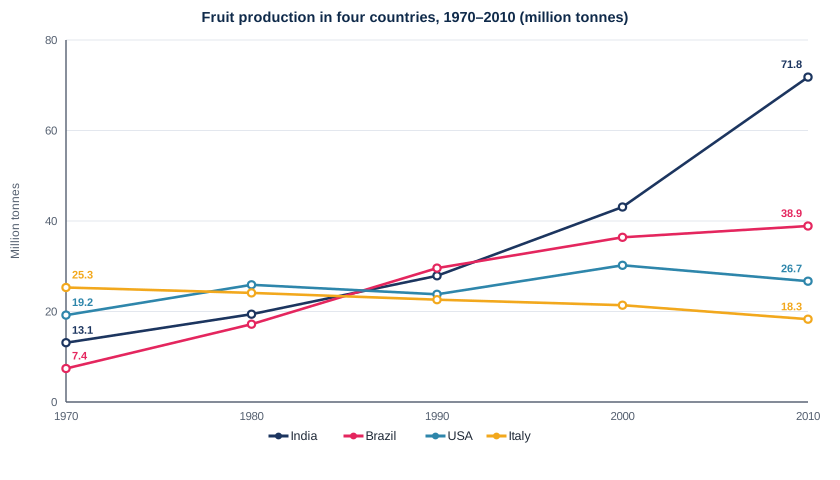
The line graph charts fruit output, in millions of tonnes, in India, Brazil, the USA and Italy at ten-year intervals from 1970 to 2010.
Overall, production grew in three of the four countries, most spectacularly in India, which became the dominant producer. Italy, by contrast, saw a gradual decline and went from first to last place.
India and Brazil started as the two smallest producers, with 13.1 and 7.4 million tonnes respectively. Both expanded rapidly, and by 1990 Brazil, at just under 30 million, had edged ahead of India (about 28 million) to lead all four countries. Thereafter their paths diverged: Brazilian growth slowed markedly, with output at about 36 million tonnes in 2000 and 38.9 million in 2010, whereas India's climbed to about 43 million and then surged to 71.8 million, more than five times its 1970 level and nearly double Brazil's.
The two countries that led in 1970 fared less well. American output fluctuated, rising from 19.2 to about 26 million tonnes in 1980, when it briefly topped the ranking, dipping to around 24 million in 1990, peaking at roughly 30 million in 2000 and ending at 26.7 million. Italy, the largest producer in 1970 with 25.3 million tonnes, declined in every decade to finish on 18.3 million, roughly a quarter of India's.
| the dominant producer | nhà sản xuất áp đảo |
| went from first to last place | từ đầu bảng xuống cuối bảng |
| expanded rapidly | mở rộng nhanh chóng |
| edged ahead of | nhích lên trước |
| growth slowed markedly | đà tăng chậm lại rõ rệt |
| fared less well | có kết quả kém hơn |
| declined in every decade | giảm qua từng thập kỷ |