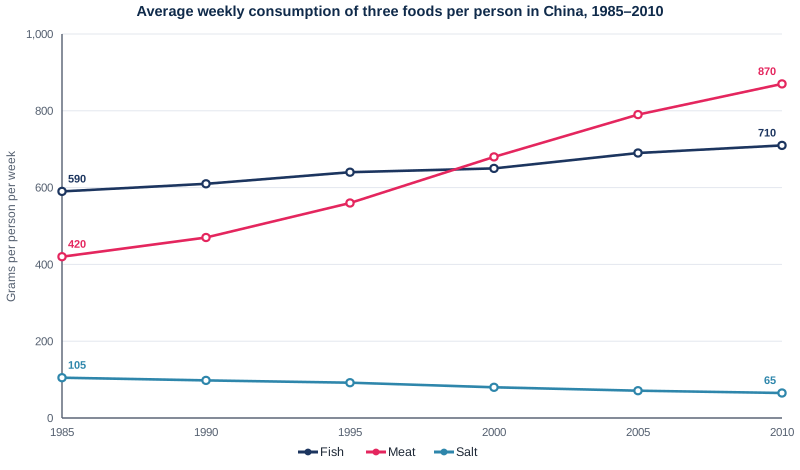
Line graph — Food consumption in China, 1985-2010
📄 Bài mẫu band 8–9
| Introduction | Paraphrase: lượng cá, thịt và muối trung bình mỗi người Trung Quốc tiêu thụ mỗi tuần, 1985–2010, đơn vị gam. |
| Overview | Overall: thịt và cá cùng tăng còn muối giảm dần; thịt tăng nhanh nhất và thay cá thành thực phẩm được ăn nhiều nhất trong ba loại. Không số liệu. |
| Body 1 | 1985: Fish 590 g, Meat 420 g. Fish lên khoảng 650 g (2000) rồi 710 g (tăng 120 g, khoảng một phần năm). Meat khoảng 560 g (1995) → khoảng 680 g (2000), vượt cá → 870 g (hơn gấp đôi, hơn cá 160 g). |
| Body 2 | Salt 105 g → khoảng 80 g (2000) → 65 g, giảm 40 g tức gần hai phần năm; năm 2010 chưa bằng một phần mười lượng cá hay thịt. |
The line graph plots the average weekly intake of fish, meat and salt per person in China, in grams, from 1985 to 2010.
Overall, the Chinese came to eat more meat and fish but less salt. Meat consumption grew far faster than that of fish, and by the end of the period it had replaced fish as the most heavily consumed of the three.
In 1985, fish was the leading item at 590 grams per person per week, well ahead of meat at 420 grams. Fish consumption rose only modestly thereafter, reaching about 650 grams in 2000 and 710 grams in 2010, an increase of roughly a fifth over the 25-year period. Meat, however, climbed from about 560 grams in 1995 to around 680 grams in 2000, overtaking fish in the late 1990s, and continued upwards to 870 grams. It had therefore more than doubled and finished 160 grams above fish, having begun 170 grams below it.
Salt was consumed in far smaller quantities and was the only item to decline. The weekly figure fell gradually from 105 grams to approximately 80 grams in 2000 and 65 grams in 2010, a drop of nearly two-fifths. By then, salt intake was less than a tenth of the figure for either fish or meat.
| had replaced fish as | đã thay thế cá trở thành |
| rose only modestly | chỉ tăng khiêm tốn |
| over the 25-year period | trong suốt giai đoạn 25 năm |
| overtaking fish | vượt qua cá |
| more than doubled | tăng hơn gấp đôi |
| in far smaller quantities | với lượng nhỏ hơn rất nhiều |
| a drop of nearly two-fifths | mức giảm gần hai phần năm |