Line graph — Fast food consumption in the UK, 1970-1990
📄 Bài mẫu band 8–9
| Introduction | Paraphrase: lượng tiêu thụ fish and chips, hamburgers và pizza ở Anh tính bằng gram mỗi người mỗi tuần, 1970–1990. |
| Overview | Overall: hamburgers và pizza được ăn ngày càng nhiều, fish and chips thất thế; cuối kỳ hamburgers thay fish and chips làm món được ăn nhiều nhất. Không số liệu. |
| Body 1 | Fish and chips 318 g năm 1970 (hơn bảy lần hamburgers 42 g, hơn hai mươi lần pizza 15 g) → 296 → 248 (1980), sau đó giảm chậm, còn 221 g năm 1990, thấp hơn khoảng 30%. |
| Body 2 | Hamburgers 42 → 88 → 164, vượt fish and chips năm 1985 (245 so với 232), kết thúc 302 g (gấp bảy); Pizza 15 → 24 (1975) rồi tăng tốc lên 187 g, hơn mười hai lần mức 1970, nhưng vẫn là món ít được ăn nhất suốt kỳ. |
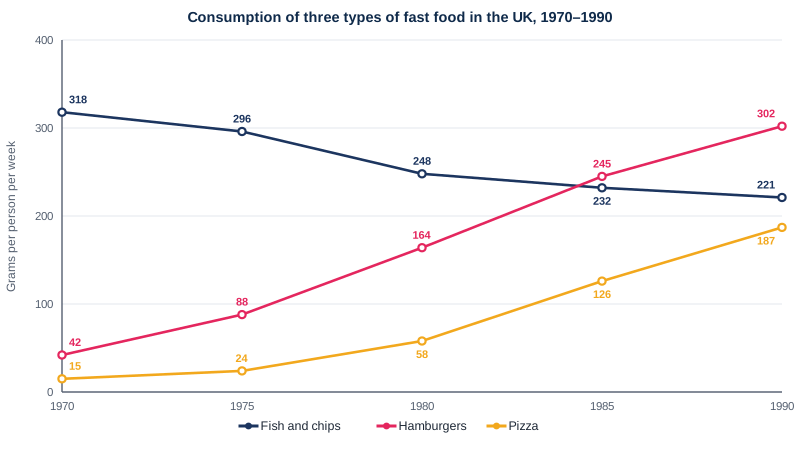
The graph charts weekly consumption per person of fish and chips, hamburgers and pizza in the UK from 1970 to 1990, measured in grams.
Overall, the British ate far more hamburgers and pizza over time, whereas fish and chips fell out of favour. As a result, hamburgers had eventually replaced fish and chips as the most widely eaten of the three.
In 1970 fish and chips was by far the most heavily consumed, at 318 grams a week, over seven times the figure for hamburgers (42 grams) and more than twenty times that for pizza (15 grams). Consumption then declined, to 296 grams in 1975 and 248 in 1980, after which the fall slowed markedly, leaving the figure at 221 grams in 1990, about 30% below its starting point.
The other two foods went from strength to strength. Hamburger consumption roughly doubled every five years up to 1980, reaching 164 grams, and by 1985 had edged past fish and chips, at 245 grams against 232; it finished at 302 grams, a sevenfold increase. Pizza grew more slowly at first, from 15 to 24 grams by 1975, but then gathered pace to stand at 187 grams in 1990, more than twelve times its 1970 level, yet still the least eaten of the three.
| fell out of favour | không còn được ưa chuộng |
| by far the most heavily consumed | được tiêu thụ nhiều vượt trội |
| the fall slowed markedly | đà giảm chậm lại rõ rệt |
| went from strength to strength | ngày càng phát triển mạnh |
| edged past | nhích lên vượt qua |
| a sevenfold increase | mức tăng gấp bảy lần |
| gathered pace | tăng tốc |