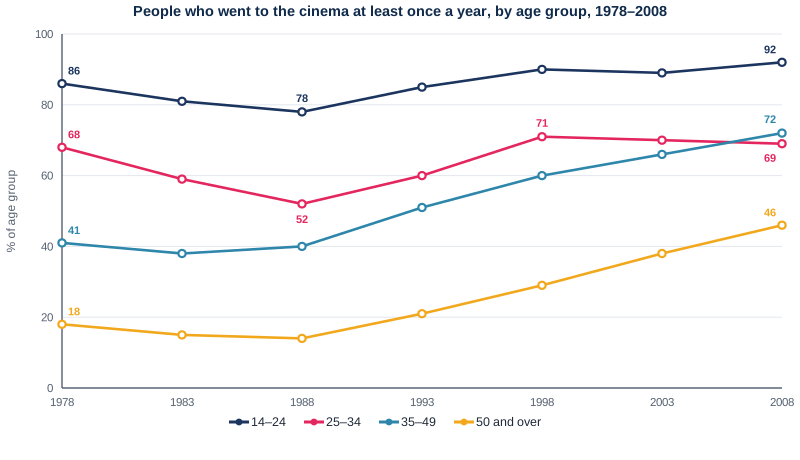
Line graph — Cinema attendance by age group, 1978-2008
📄 Bài mẫu band 8–9
| Introduction | Paraphrase: tỉ lệ người thuộc bốn nhóm tuổi ở một nước đi xem phim ít nhất một lần mỗi năm, giai đoạn 1978–2008. |
| Overview | Overall: tỉ lệ tăng rõ ở ba nhóm, mạnh nhất ở hai nhóm lớn tuổi; riêng nhóm 25–34 sụt sâu rồi về gần đúng mức ban đầu (hơn 1 điểm); 14–24 luôn cao nhất, 50 and over luôn thấp nhất. Không số liệu. |
| Body 1 | 14–24: 86% (1978) → đáy 78% (1988) → 92% (2008). 25–34: 68% → 52% (1988) → 71% (1998) → 69% (2008), hơn mức đầu đúng 1 điểm. |
| Body 2 | 35–49: quanh 40% đến 1988 (41% năm 1978) rồi lên 72%, vượt nhóm 25–34 trong 5 năm cuối. 50 and over: 18% → khoảng 14% (1988, ước theo lưới) → 46%, hơn 2,5 lần. Khoảng cách già–trẻ: 68 → 46 điểm. |
The line graph tracks the proportion of people in four age brackets in one country who visited the cinema at least once a year between 1978 and 2008.
Overall, cinema attendance rose appreciably in three of the four groups, with the two older ones recording the greatest growth, whereas the second-youngest group dipped sharply and ended almost exactly where it had started. The youngest group were the keenest cinema-goers throughout and the oldest the least keen.
Among those aged 14–24, attendance slipped from 86% in 1978 to a low of 78% in 1988, then recovered to 92% by 2008. The 25–34 group suffered a much deeper decline, from 68% to 52% by 1988. Although it bounced back to 71% by 1998, it then levelled off and stood at 69% in 2008, one point above the initial level.
The 35–49 group, which started at 41%, hovered around 40% until 1988, after which it climbed steadily to 72%, overtaking the 25–34s in the final five years. The rate for people aged 50 and over, always the lowest, dipped from 18% to about 14% in 1988 and then rose to 46%, more than two and a half times the 1978 figure. Consequently, the gap between the oldest and youngest groups shrank from 68 to 46 percentage points.
| rose appreciably | tăng đáng kể |
| the keenest cinema-goers | những người đi xem phim nhiều nhất |
| a low of | mức thấp nhất là |
| suffered a much deeper decline | sụt giảm sâu hơn nhiều |
| bounced back to | bật tăng trở lại mức |
| levelled off | chững lại, đi ngang |
| hovered around | dao động quanh mức |
| shrank from | thu hẹp từ |