Line graph — Sales of a car manufacturer by region, 2002-2006
📄 Bài mẫu band 8–9
| Introduction | Paraphrase: số xe (nghìn chiếc) một hãng ô tô bán ở bốn khu vực mỗi năm, 2002–2006. |
| Overview | Overall: Asia tăng vọt từ thứ ba lên thứ nhất; North America dẫn đầu gần suốt kỳ nhưng giảm từng năm; Europe và South America ít đổi, South America nhỏ nhất. Không số liệu. |
| Body 1 | 2002: North America 870 nghìn, gấp hơn 3,5 lần Asia 240 nghìn. North America → 695 (mất 175). Asia khoảng 420 (2004), 560 (2005), rồi 775: hơn gấp ba, vượt Europe và North America năm 2006, hơn North America 80 nghìn. |
| Body 2 | Europe 585 → đỉnh khoảng 640 (2004) → 634. South America dưới 150 nhẹ trong 2003–2004 rồi lên 188, chưa bằng một phần tư Asia. |
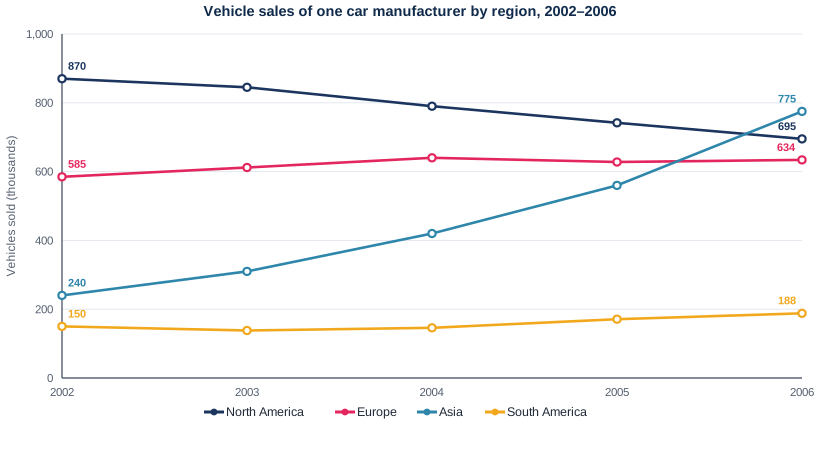
The line graph tracks how many vehicles, in thousands, a car maker sold in four world regions each year from 2002 to 2006.
Overall, sales in Asia soared, taking the region from third place to first, while North America, the leading market for most of the period, saw its sales fall every year. Europe and South America changed comparatively little, the latter remaining by far the smallest market.
In 2002, North America accounted for 870,000 vehicles, more than three and a half times Asia's 240,000. The two then moved in opposite directions. North American sales fell steadily to 695,000 in 2006, a loss of 175,000, whereas Asian sales rose at an accelerating pace, passing about 420,000 in 2004 and 560,000 in 2005 before leaping to 775,000. Asia's sales thus more than tripled, and in the final year the region overtook both Europe and North America, finishing 80,000 ahead of the latter.
European sales were comparatively stable, edging up from 585,000 to a peak of around 640,000 in 2004 and ending at 634,000. South America lagged far behind: its sales dipped slightly below the initial 150,000 in 2003 and 2004 before recovering to 188,000, less than a quarter of the Asian total.
| the leading market | thị trường dẫn đầu |
| moved in opposite directions | đi theo hai hướng ngược nhau |
| at an accelerating pace | với tốc độ ngày càng nhanh |
| more than tripled | tăng hơn gấp ba |
| finishing 80,000 ahead of | về đích hơn (ai đó) 80.000 |
| comparatively stable | tương đối ổn định |
| lagged far behind | tụt lại rất xa phía sau |