Line graph — Births and deaths in Europe, 1950-2050
📄 Bài mẫu band 8–9
| Introduction | Paraphrase: số ca sinh và ca tử mỗi năm ở châu Âu (triệu), 1950–2020, kèm dự báo tới 2050. |
| Overview | Overall: số sinh giảm dài hạn còn số tử tăng chậm; hai đường cắt nhau cuối thế kỷ 20, từ đó số tử vượt số sinh và khoảng cách được dự báo tiếp tục nới rộng. Không số liệu. |
| Body 1 | 1950: sinh 12.1 triệu, gần gấp đôi tử 6.4 triệu. Sinh xuống 10 triệu (1980) rồi khoảng 7.4 triệu (2000); tử khoảng 6.2 (1960) lên khoảng 8.3 (2000) → cắt nhau thập niên 1990. 2010: sinh nhích lên khoảng 7.9, tử khoảng 8.1; 2020: 6.9 so với 8.6. |
| Body 2 | Dự báo 2050: sinh giảm dần còn 6 triệu (khoảng một nửa mức 1950), tử lên 9.4 triệu; mức thiếu hụt từ khoảng 1.7 triệu (2020) lên 3.4 triệu, tức gấp đôi. |
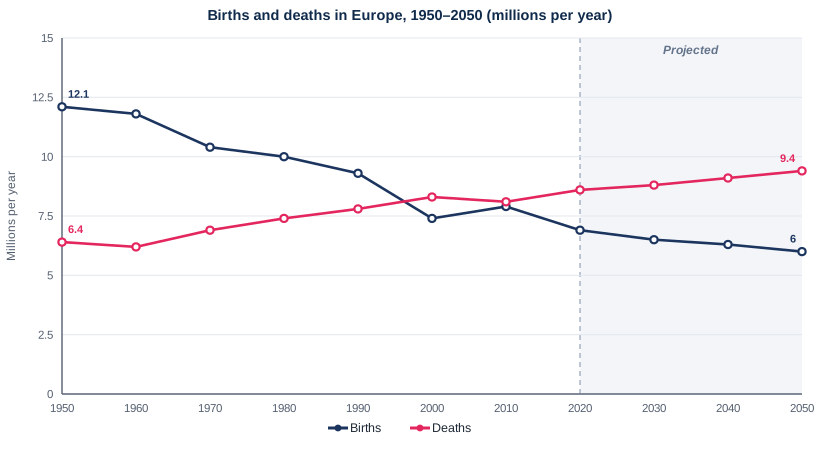
The line graph traces how many people were born and how many died each year in Europe between 1950 and 2020, with forecasts to 2050. Figures are in millions.
Overall, births followed a long-term downward trend while deaths crept upwards. The two lines crossed towards the end of the twentieth century, since when deaths have outnumbered births, and this gap is expected to grow.
In 1950, Europe recorded 12.1 million births, almost double the 6.4 million deaths. Births then fell in every decade up to 2000, slipping to 10 million by 1980 before dropping sharply to about 7.4 million in 2000. Deaths, after dipping to roughly 6.2 million in 1960, climbed steadily to around 8.3 million by 2000, so the lines intersected in the 1990s. A brief recovery in births to about 7.9 million in 2010 almost closed the gap with deaths (around 8.1 million), but by 2020 births had fallen back to roughly 6.9 million while deaths had reached about 8.6 million.
Looking ahead, births are projected to decline more gradually, to 6 million in 2050, approximately half the 1950 level, whereas deaths are expected to reach 9.4 million. If these forecasts prove accurate, the annual shortfall of births will double, from about 1.7 million in 2020 to 3.4 million.
| followed a long-term downward trend | đi theo xu hướng giảm dài hạn |
| deaths have outnumbered births | số ca tử đã vượt số ca sinh |
| dropping sharply | giảm mạnh |
| A brief recovery | một đợt phục hồi ngắn |
| closed the gap | khép lại, xoá khoảng cách |
| are projected to decline | được dự báo sẽ giảm |
| are expected to reach | được dự kiến đạt mức |