Line graph — Australian exports to four countries, 1990-2012
📄 Bài mẫu band 8–9
| Introduction | Paraphrase: tỉ lệ phần trăm hàng xuất khẩu của Úc bán sang Japan, China, USA, India từ 1990 đến 2012. |
| Overview | Overall: China từ khách hàng nhỏ thành thị trường lớn nhất trong bốn nước, tỉ trọng của Japan và USA co lại; India tăng nhẹ nhưng vẫn là thị trường nhỏ. Không số liệu. |
| Body 1 | Japan 26% (1990), gần 9 lần China 3%; xuống khoảng 18% (2004), hồi lên 22% (2008), về 19%. China ≤ 5% tới 1998, khoảng 15% năm 2008, gấp đôi lên 30% năm 2012; vượt Japan ngay trước 2010, hơn 11 điểm. |
| Body 2 | USA 11% → khoảng 6% (1996) → khoảng 10% (2000) → 4%. India không quá 2% tới 2002, lên 7% năm 2008 (vượt USA), giữ 7% năm 2010, về 5% năm 2012, vẫn hơn USA 1 điểm. |
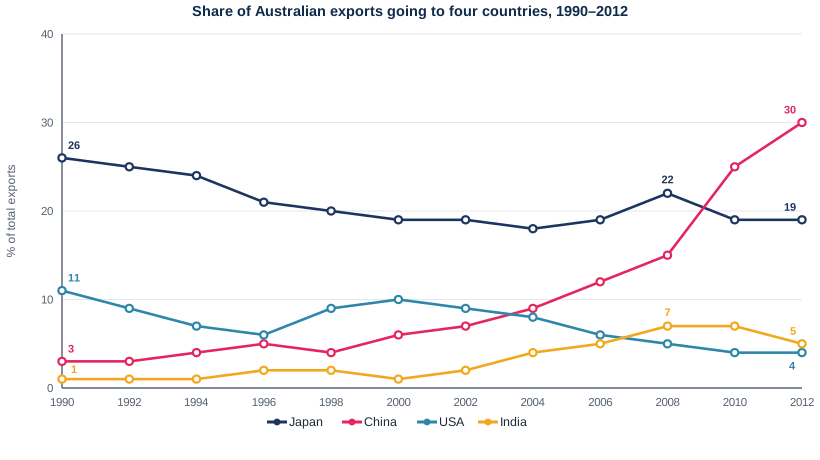
The line graph tracks the percentage of Australia's exports that went to Japan, China, the USA and India between 1990 and 2012.
Overall, China rose from a minor customer to the leading export destination of the four, whereas Japan's and the USA's shares contracted. India's share grew a little yet remained marginal throughout.
In 1990 Japan bought 26% of Australian exports, almost nine times China's 3%. Its share then drifted downwards to around 18% in 2004 and, after a brief recovery to 22% in 2008, settled at 19%. China's share, by contrast, stayed at or below 5% until 1998 but had climbed to about 15% by 2008, passing the USA on the way; it then doubled in just four years to 30%. This surge took China past Japan shortly before 2010 and, at ten times its 1990 level, left it 11 points clear by 2012.
The USA began as the second-largest buyer, at 11%. Its share fell to about 6% in 1996 and, although it rallied to roughly 10% in 2000, declined thereafter to end at 4%. India, which took no more than 2% until 2002, climbed to 7% in 2008, edging ahead of the USA, held that level in 2010 and still stood one point above it in 2012 despite slipping back to 5%.
| the leading export destination | thị trường xuất khẩu dẫn đầu |
| drifted downwards | trượt dần xuống |
| after a brief recovery | sau một đợt hồi phục ngắn |
| doubled in just four years | tăng gấp đôi chỉ trong bốn năm |
| ten times its 1990 level | gấp mười lần mức năm 1990 |
| rallied to | bật tăng trở lại mức |
| edging ahead of | nhích lên vượt qua |