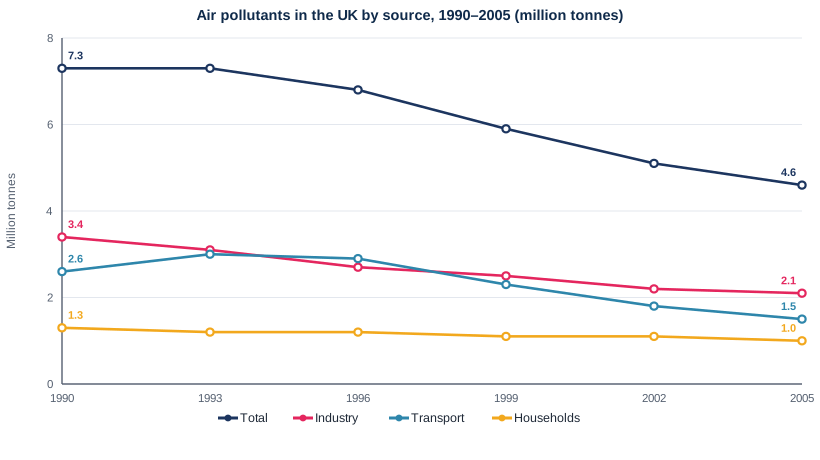
Line graph — Sources of air pollutants in the UK, 1990-2005
📄 Bài mẫu band 8–9
| Introduction | Paraphrase: đồ thị đường theo dõi lượng khí ô nhiễm thải ra ở Anh 1990–2005, tính bằng triệu tấn, gồm tổng số và ba nguồn industry, transport, households. |
| Overview | Overall: tổng lượng phát thải giảm đáng kể, bắt đầu sau 1993; phần giảm đến chủ yếu từ industry và transport, còn households — nguồn nhỏ nhất suốt kỳ — hầu như không đổi. Không số liệu. |
| Body 1 | Total 7.3 triệu tấn năm 1990 và 1993, rồi giảm liên tục còn 4.6 năm 2005 (giảm 2.7, hơn một phần ba). Industry 3.4 → khoảng 2.7 (1996) → 2.1. |
| Body 2 | Transport 2.6 → khoảng 3.0 (1993), năm 1996 ở mức khoảng 2.9 nên vượt industry, rồi giảm còn 1.5 (bằng nửa đỉnh). Industry + transport giảm 2.4 trong tổng 2.7. Households 1.3 → 1.0, tỉ trọng tăng từ dưới lên trên một phần năm. |
The line graph tracks how many million tonnes of air pollutants were emitted in the UK from 1990 to 2005, both in total and from industry, transport and households.
Overall, total emissions fell substantially, although the decline only set in a few years into the period. Industry and transport accounted for the bulk of this reduction, while household emissions, the smallest source throughout, barely changed.
The overall figure stood at 7.3 million tonnes in both 1990 and 1993, then fell without interruption to 4.6 million in 2005, a drop of 2.7 million tonnes, or more than a third. Industry, the largest contributor at the outset with 3.4 million tonnes, declined steadily throughout, passing about 2.7 million in 1996 and ending at 2.1 million.
Transport followed a different course. Its emissions first rose from 2.6 to around 3.0 million tonnes in 1993 and, at roughly 2.9 million in 1996, briefly exceeded those of industry. Thereafter they fell more steeply than those of any other source, reaching 1.5 million by 2005, half their peak. Together, these two sectors were responsible for 2.4 of the 2.7 million tonnes cut. Household emissions, by contrast, merely drifted down from 1.3 to 1.0 million tonnes, so their share of the total actually grew from under a fifth to over a fifth.
| accounted for the bulk of | chiếm phần lớn |
| fell without interruption | giảm liên tục, không ngắt quãng |
| the largest contributor at the outset | nguồn đóng góp lớn nhất lúc đầu |
| briefly exceeded | vượt lên trong thời gian ngắn |
| fell more steeply than | giảm dốc hơn so với |
| drifted down | giảm rất chậm, nhích dần xuống |
| their share of the total | tỉ trọng của chúng trong tổng số |