Bar chart — Weekly household spending, 1968 and 2018
📄 Bài mẫu band 8–9
| Introduction | Paraphrase: một hộ gia đình điển hình ở một nước chia ngân sách hằng tuần cho tám khoản chi thế nào vào năm 1968 và năm mươi năm sau. |
| Overview | Overall: Food là khoản lớn nhất lúc đầu nhưng bị Leisure thay thế; tỉ trọng cho thực phẩm, quần áo, hàng thiết yếu giảm, còn nhà ở, đi lại, giải trí tăng. Không số liệu. |
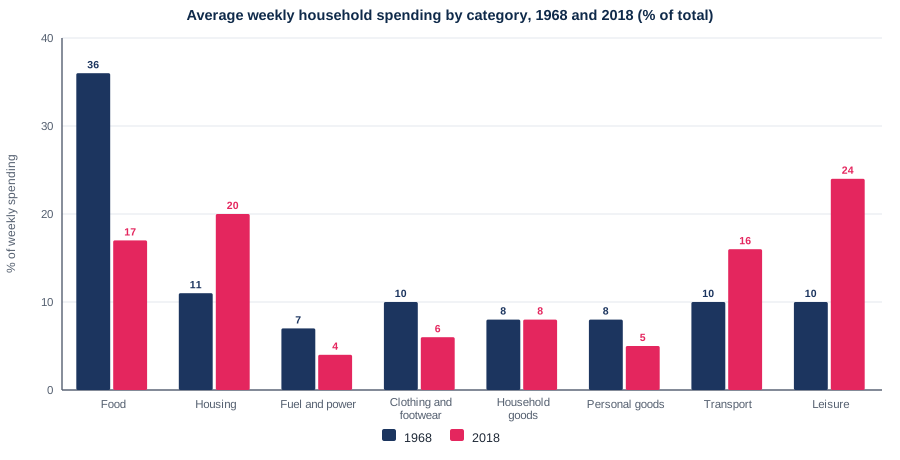
| Body 1 | Food 36% → 17% (giảm hơn một nửa); Clothing and footwear 10% → 6%; Personal goods 8% → 5%; Fuel and power 7% → 4% (nhỏ nhất cả hai năm); Household goods giữ 8%. |
| Body 2 | Leisure 10% → 24% (gần 2,5 lần, thành khoản lớn nhất); Transport 10% → 16%; Housing 11% → 20% (vượt Food, đứng thứ hai); ba khoản cộng lại 31% → 60%. |
The bar chart shows what proportion of its weekly budget a typical household in one country devoted to each of eight types of expenditure in 1968 and again fifty years later.
Overall, food was by far the biggest expense at the start of the period but had been replaced by leisure by the end. More generally, the share spent on food, clothing and other everyday items shrank, while housing, transport and leisure all expanded considerably.
The most dramatic change concerned food, which absorbed over a third of weekly spending (36%) in 1968 but only 17% in 2018, so its share more than halved. Three smaller categories also declined: clothing and footwear from 10% to 6%, personal goods from 8% to 5%, and fuel and power from 7% to 4%, the lowest figure in both years. Household goods, by contrast, remained unchanged at 8%.
The opposite trend was seen in the other three categories. Leisure and transport, like clothing, had each claimed 10% in 1968, but leisure grew to almost two and a half times that level, becoming the largest single item at 24%, while transport reached 16%. Housing nearly doubled from 11% to 20%, moving ahead of food into second place. Taken together, these three areas grew from 31% of the budget to 60%.
| the share spent on | tỉ trọng chi cho |
| absorbed over a third | ngốn hơn một phần ba |
| more than halved | giảm hơn một nửa |
| remained unchanged at | giữ nguyên ở mức |
| The opposite trend was seen in | Xu hướng ngược lại thấy ở |
| almost two and a half times | gần gấp hai lần rưỡi |
| Taken together | Gộp lại |