Bar chart — Amount of waste produced in six countries
📄 Bài mẫu band 8–9
| Introduction | Paraphrase: lượng rác sinh hoạt mỗi người thải ra một năm (kg) ở sáu nước, năm 2000 và 2015. |
| Overview | Overall: năm trong sáu nước giảm, riêng Denmark tăng và thay USA thành nước xả nhiều nhất; Poland thấp nhất ở cả hai năm. Không số liệu. |
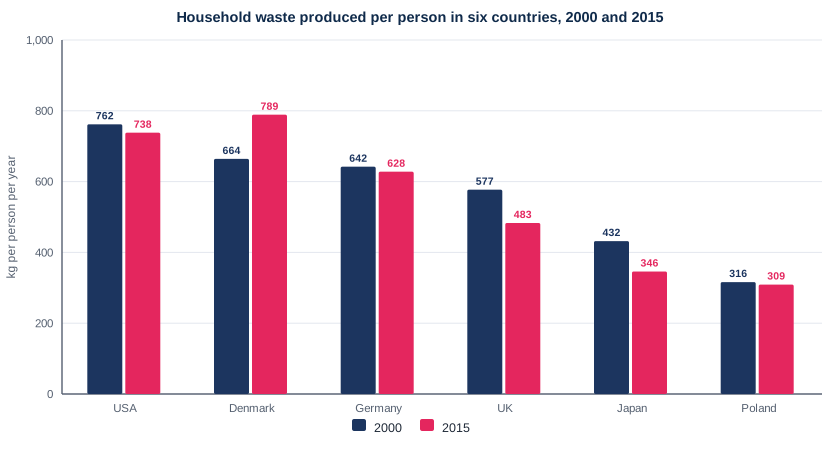
| Body 1 | Năm 2000: USA 762 kg, hơn Denmark (664 kg) gần 100 kg, Germany 642 kg. Năm 2015: USA 738 kg, Germany 628 kg, Denmark tăng 125 kg lên 789 kg, cao hơn USA 51 kg. |
| Body 2 | UK 577 → 483 kg (giảm 94 kg); Japan 432 → 346 kg (giảm một phần năm); Poland 316 → 309 kg, năm 2015 chưa bằng một nửa Denmark. |
The bar chart illustrates how much household waste each person generated annually, in kilograms, in six countries in 2000 and again in 2015.
Overall, waste per person went down in five of the six countries; Denmark was the sole exception and consequently replaced the USA as the biggest producer. Poland generated the least in both years.
In 2000, the USA topped the list with 762 kg per person, almost 100 kg more than Denmark (664 kg) and well ahead of Germany (642 kg). Fifteen years later, the American figure had edged down to 738 kg and the German one to 628 kg, whereas Denmark's had climbed by 125 kg to 789 kg, the highest amount shown for either year. Denmark had therefore moved from second place to first, 51 kg above the USA.
The steepest reductions occurred in the UK and Japan. Waste in Britain fell from 577 to 483 kg per head, a drop of 94 kg, while the Japanese figure went down by a fifth, from 432 to 346 kg. Poland's output remained almost static, at 316 kg and then 309 kg, and it was comfortably the lowest of the six: by 2015, a Pole produced well under half as much household waste as a Dane.
| the sole exception | ngoại lệ duy nhất |
| topped the list | đứng đầu danh sách |
| edged down | nhích xuống |
| climbed by | tăng thêm (bao nhiêu) |
| The steepest reductions | những mức giảm mạnh nhất |
| remained almost static | gần như đứng yên |
| well under half as much | chưa bằng một nửa, kém khá xa |