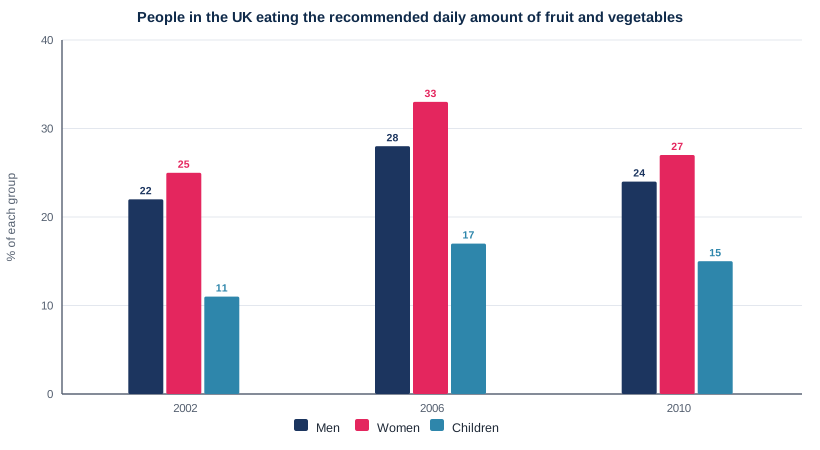
Bar chart — People in the UK eating the recommended amount of fruit and vegetables, 2002, 2006 and 2010
📄 Bài mẫu band 8–9
| Introduction | Paraphrase: tỉ lệ nam, nữ và trẻ em ở Anh ăn đủ lượng rau quả khuyến nghị mỗi ngày trong ba năm 2002, 2006, 2010. |
| Overview | Cả ba nhóm đạt đỉnh ở năm giữa rồi giảm lại, nhưng đều kết thúc cao hơn lúc đầu; phụ nữ luôn cao nhất, trẻ em luôn thấp nhất. Không số liệu. |
| Body 1 | 2002 → 2006: Women 25% → 33% (cao nhất biểu đồ, tăng 8 điểm); Men 22% → 28% và Children 11% → 17% (cùng tăng 6 điểm); trẻ em vẫn chỉ bằng khoảng một nửa phụ nữ. |
| Body 2 | 2010: Women 27% (giảm 6 điểm, mạnh nhất), Men 24%, Children 15%; vẫn hơn 2002 lần lượt 2, 2 và 4 điểm; khoảng cách phụ nữ – trẻ em 14 → 16 → 12 điểm. |
The bar chart illustrates the proportions of British men, women and children who consumed the recommended daily quantity of fruit and vegetables in 2002, 2006 and 2010.
Overall, the figures for all three groups peaked in the middle year before falling back, although each ended the period above its starting point. Women were consistently the most likely to meet the guideline, and children the least.
Between 2002 and 2006, compliance with the guideline improved across the board. The share of women meeting the target rose from 25% to 33%, the highest figure in the chart. Men and children each gained six percentage points, reaching 28% and 17% respectively, which meant that children, despite the improvement, were still only about half as likely as women to eat the recommended amount.
By 2010, however, this progress had been partly reversed. The proportion of women dropped by six points to 27%, the steepest fall of the three, while that of men slipped to 24% and that of children to 15%. Even so, all three figures remained above their 2002 levels, by two points for adults and four for children. Because the decline was smallest among children, the gap between them and women narrowed to 12 points, compared with 14 in 2002 and 16 in 2006.
| consistently the most likely to | luôn là nhóm có khả năng cao nhất (làm gì) |
| across the board | ở tất cả các nhóm, đồng loạt |
| meeting the target | đạt mức khuyến nghị/mục tiêu |
| half as likely as | khả năng chỉ bằng một nửa so với |
| partly reversed | bị đảo ngược một phần |
| the steepest fall of the three | mức giảm mạnh nhất trong ba nhóm |
| remained above their 2002 levels | vẫn cao hơn mức năm 2002 |