Bar chart — Renewable fuel use in transport in six EU countries, 2009-2010
📄 Bài mẫu band 8–9
| Introduction | Paraphrase: tỉ lệ nhiên liệu giao thông lấy từ nguồn tái tạo ở sáu nước thành viên EU trong hai năm 2009 và 2010. |
| Overview | Overall: bốn trong sáu nước tăng, chỉ Slovakia và Austria giảm, nhưng xét về số tuyệt đối mọi thay đổi đều nhỏ; Slovakia vẫn dẫn đầu, UK xếp cuối ở cả hai năm. Không số liệu. |
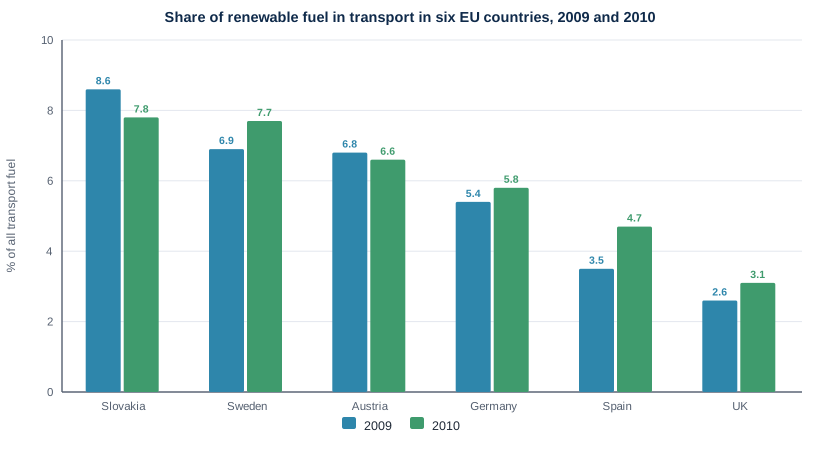
| Body 1 | Slovakia 8.6% → 7.8%; Sweden 6.9% → 7.7% (cùng biên độ 0,8 điểm, khoảng cách 1,7 điểm còn gần như bằng không); Austria 6.8% → 6.6%. |
| Body 2 | Germany 5.4% → 5.8%; Spain 3.5% → 4.7% (tăng mạnh nhất, 1,2 điểm); UK 2.6% → 3.1%, chưa bằng nửa Slovakia năm 2010, và năm 2009 Slovakia gấp hơn ba lần. |
The bar chart compares six EU member states in terms of the proportion of their transport fuel that was obtained from renewable sources in 2009 and 2010.
Overall, the share of renewable fuel rose in four of the six countries, with only Slovakia and Austria recording falls, although in absolute terms every change was small. Slovakia nevertheless remained the leading user in both years, while the UK lagged behind all the others.
Among the three highest-ranked countries, Slovakia's figure dropped from 8.6% to 7.8%, whereas Sweden's rose by the same margin of 0.8 percentage points, from 6.9% to 7.7%. Consequently, a gap of 1.7 points between the two shrank to almost nothing. Austria, which had been virtually level with Sweden in 2009 at 6.8%, edged down to 6.6%.
The remaining three countries all made gains from lower starting points. Germany saw a marginal increase from 5.4% to 5.8%, while Spain went from 3.5% to 4.7%, the largest rise on the chart at 1.2 points. The UK also improved, from 2.6% to 3.1%, yet this was still less than half of the Slovakian figure in 2010, and a year earlier Slovakia's share had been more than three times as high.
| lagged behind | tụt lại phía sau |
| rose by the same margin | tăng đúng bằng biên độ đó |
| shrank to almost nothing | thu hẹp gần như bằng không |
| virtually level with | gần như ngang bằng với |
| edged down | nhích xuống |
| a marginal increase | mức tăng rất nhẹ |
| less than half of | chưa bằng một nửa |