Bar chart — Sales of a pharmaceutical company by region, 2010-2020
📄 Bài mẫu band 8–9
| Introduction | Paraphrase: doanh thu hằng năm (tỉ đô la Mỹ) của một hãng dược đa quốc gia ở năm khu vực, các năm 2010, 2015, 2020. |
| Overview | Overall: Asia tăng nhanh nhất và thành thị trường lớn nhất vào cuối kỳ; Europe là nơi duy nhất giảm liên tục; Africa luôn thấp nhất dù có tăng. Không số liệu. |
| Body 1 | 2010: North America 14.2, Europe 12.6, Asia 5.3. Asia → 9.7 → 16.3 (khoảng gấp ba). North America đỉnh 15.8 rồi 15.1, kém Asia 1.2. Europe 11.9 → 10.4. |
| Body 2 | South America 3.1 → 4.4 → 3.9. Africa 1.2 → 2.6 (hơn gấp đôi, chủ yếu sau 2015), năm 2020 vẫn chỉ bằng hai phần ba South America. |
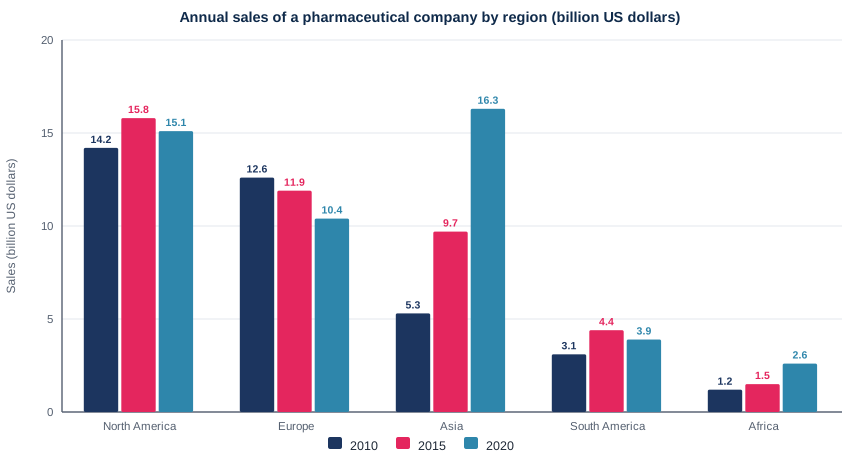
The bar chart gives the yearly sales revenue, in billions of US dollars, that a multinational drug company earned in five world regions in 2010, 2015 and 2020.
Overall, Asia grew far faster than any other region and ended the period as the company's largest market, while Europe was the only region where sales fell continuously. Africa generated the least revenue in all three years, despite growing.
In 2010, North America led with sales of $14.2 billion, followed by Europe at $12.6 billion, whereas Asia stood at only $5.3 billion. Over the next decade, Asian sales climbed to $9.7 billion in 2015 and then to $16.3 billion, roughly three times the original figure. North American revenue, by contrast, peaked at $15.8 billion in 2015 before slipping back to $15.1 billion, which left it $1.2 billion behind Asia. European sales declined throughout, to $11.9 billion and then, more sharply, to $10.4 billion.
The other two regions were minor markets by comparison. South America's sales rose from $3.1 billion to $4.4 billion before easing to $3.9 billion. Africa's revenue more than doubled, from $1.2 billion to $2.6 billion, with most of that growth coming after 2015, yet even in 2020 it was only two-thirds of South America's.
| ended the period as | kết thúc giai đoạn với vị thế là |
| generated the least revenue | tạo ra doanh thu thấp nhất |
| roughly three times | xấp xỉ gấp ba lần |
| slipping back to | tụt nhẹ trở lại mức |
| declined throughout | giảm suốt cả giai đoạn |
| minor markets by comparison | thị trường nhỏ nếu đem so sánh |
| more than doubled | tăng hơn gấp đôi |