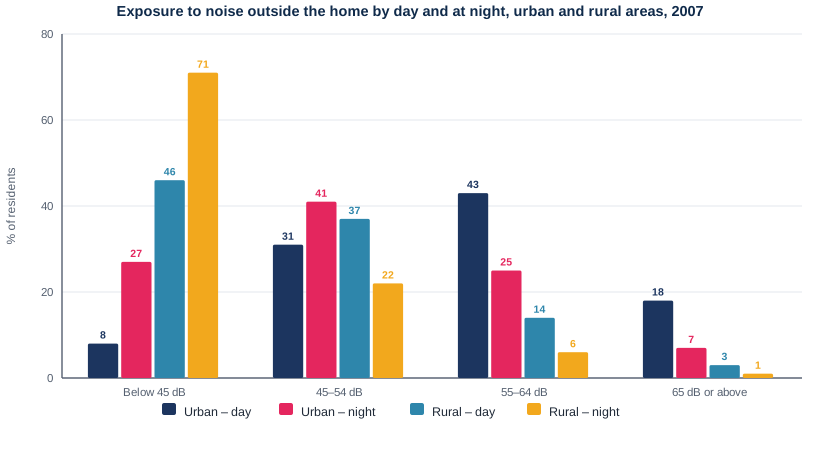
Bar chart — Exposure to noise by day and at night in urban and rural areas, 2007
📄 Bài mẫu band 8–9
| Introduction | Paraphrase: tỉ lệ cư dân thành thị và nông thôn của một nước châu Âu chịu bốn mức tiếng ồn ngoài nhà, ban ngày và ban đêm, năm 2007. |
| Overview | Dân thành thị chịu tiếng ồn lớn hơn hẳn dân nông thôn ở cả hai thời điểm; ở cả hai khu vực ban đêm đều yên tĩnh hơn rõ. Không số liệu. |
| Body 1 | Thành thị ban ngày: 55–64 dB 43%, từ 65 dB 18%, dưới 45 dB chỉ 8%. Ban đêm: 45–54 dB lên 41% (từ 31%), dưới 45 dB tăng hơn gấp ba lên 27%, hai mức ồn nhất còn 25% và 7%. |
| Body 2 | Nông thôn: dưới 45 dB 46% ban ngày, 71% ban đêm (hơn gấp đôi thành thị); 45–54 dB 37% và 22%; 55–64 dB 14% và 6%; từ 65 dB chỉ 3% và 1%. |
The bar chart shows what proportion of urban and rural residents in a European country experienced four levels of noise outside their homes in 2007, both by day and at night.
Overall, town and city dwellers were exposed to far higher noise levels than people in the countryside at both times of day. In both types of area, however, the surroundings were markedly quieter at night.
In urban areas, the most common daytime level was 55–64 dB, which affected 43% of residents, and a further 18% lived with 65 dB or more; only 8% enjoyed levels below 45 dB. At night the distribution shifted downwards: 45–54 dB became the largest category, at 41% (up from 31%), the proportion in the quietest band more than tripled to 27%, and the two loudest bands shrank to 25% and 7%.
Rural residents were concentrated in the lowest band. Almost half of them (46%) had noise levels below 45 dB during the day, and this rose to 71% at night, well over double the urban figure. A further 37% by day and 22% at night fell into the 45–54 dB range. Noise of 55–64 dB was comparatively rare, at 14% and 6%, and 65 dB or above affected a tiny minority of just 3% and 1% respectively.
| markedly quieter | yên tĩnh hơn rõ rệt |
| the distribution shifted downwards | phân bố dịch xuống các mức thấp hơn |
| more than tripled | tăng hơn gấp ba |
| were concentrated in | tập trung ở |
| well over double the urban figure | cao hơn hẳn gấp đôi con số ở thành thị |
| comparatively rare | tương đối hiếm |
| a tiny minority | một thiểu số rất nhỏ |