Bar chart — Manufacturing output of Asia, Europe and the rest of the world
📄 Bài mẫu band 8–9
| Introduction | Paraphrase: tỉ trọng sản lượng công nghiệp chế tạo toàn cầu của Asia, Europe và phần còn lại của thế giới ở bốn mốc 1990–2020. |
| Overview | Overall: Asia từ nhỏ nhất vươn lên chiếm hơn một nửa sản lượng thế giới; Europe và phần còn lại đều mất thị phần, Europe giảm nhiều hơn. Không số liệu. |
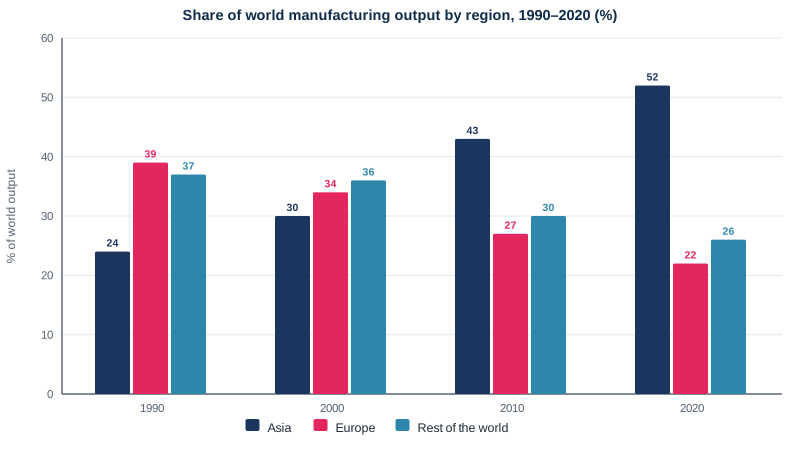
| Body 1 | Asia 24% (1990) → 30% (2000, vẫn thấp nhất) → 43% (2010, đã vượt cả hai) → 52% (2020): hơn gấp đôi, lớn hơn hai khu vực kia cộng lại. |
| Body 2 | Europe 39% → 34% → 27% → 22% (mất 17 điểm phần trăm); Rest of the world 37% → 36% (dẫn đầu năm 2000) → 30% → 26%, luôn nhỉnh hơn Europe từ 2000. |
The bar chart illustrates how global manufacturing output was divided between Asia, Europe and the rest of the world at four points between 1990 and 2020.
Overall, Asia went from being the smallest producer of the three to the source of over half of the world's manufactured goods. Europe and the rest of the world both lost ground as a result, with Europe experiencing the larger fall.
Asia accounted for just 24% of world output in 1990, well behind the other two. Its share rose to 30% in 2000, still the lowest, before jumping to 43% in 2010, by which time it had overtaken both competitors. A further increase took it to 52% in 2020, meaning that Asia's share had more than doubled in thirty years and now exceeded that of all other regions combined.
The reverse was true of Europe, which was the leading manufacturer in 1990, at 39%. Its share fell at every stage, to 34%, 27% and finally 22%, a loss of 17 percentage points. The rest of the world held almost steady at first, slipping only from 37% to 36%, which briefly made it the largest producer in 2000. It then declined to 30% and 26%, although it remained slightly ahead of Europe from 2000 onwards.
| lost ground | mất dần vị thế, mất thị phần |
| accounted for just 24% | chỉ chiếm 24% |
| overtaken both competitors | vượt qua cả hai đối thủ |
| more than doubled | tăng hơn gấp đôi |
| The reverse was true of | Điều ngược lại xảy ra với |
| fell at every stage | giảm ở mọi mốc |
| remained slightly ahead of | vẫn nhỉnh hơn một chút so với |