Bar chart — Sales of luxury homes in eight cities
📄 Bài mẫu band 8–9
| Introduction | Paraphrase: số nhà hạng sang (giá trên 1 triệu đô la Mỹ) bán ra ở tám thành phố trong hai năm liền nhau 2015 và 2016. |
| Overview | Overall: London và New York là hai thị trường lớn nhất ở cả hai năm nhưng đổi vị trí; năm nơi tăng, ba nơi giảm nên các thị trường xích lại gần nhau. Không số liệu. |
| Body 1 | London 4,120 → 3,350 (giảm 770, nhiều nhất); New York 3,460 → 3,710, lên dẫn đầu; Hong Kong 2,210 → 1,540 (gần một phần ba); Dubai 1,890 → 1,430. |
| Body 2 | Toronto 870 → 1,560, nhỉnh hơn Hong Kong; Sydney 1,380 → 1,920, lên thứ ba; Paris 1,640 → 1,810; Singapore 1,050 và 1,090, gần đứng yên; khoảng cách cao nhất–thấp nhất 3,250 → 2,620. |
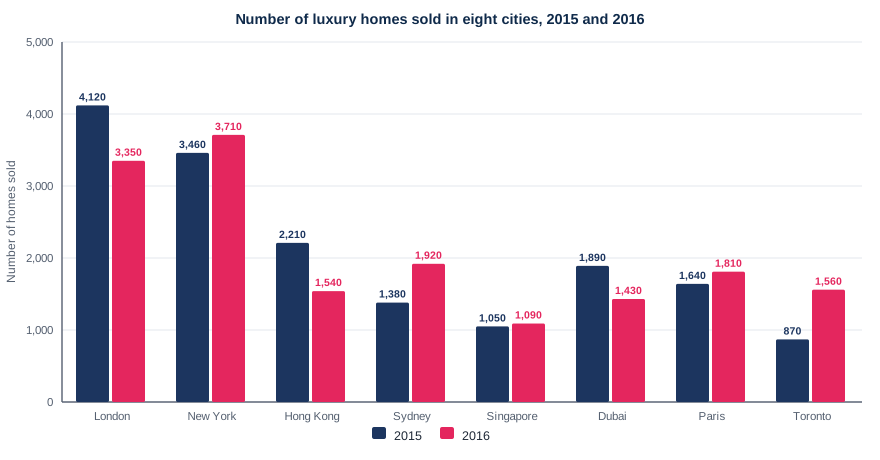
The bar chart shows how many luxury homes, meaning properties priced above one million US dollars, were sold in eight world cities in 2015 and 2016.
Overall, London and New York were the two largest markets in both years, although they swapped places at the top. Sales rose in five cities and fell in the other three, so the eight markets ended up closer together.
London sold 4,120 luxury homes in 2015 but suffered the largest fall, of 770 properties, to 3,350. New York, by contrast, climbed from 3,460 to 3,710 and took the lead. The two other declines were proportionally steeper: sales in Hong Kong dropped by almost a third, from 2,210 to 1,540, while those in Dubai went down from 1,890 to 1,430.
The most striking growth was in Toronto, where the figure jumped from 870, the lowest on the chart, to 1,560, putting it narrowly ahead of Hong Kong. Sydney also recorded a substantial rise, from 1,380 to 1,920, to become the third largest market. Elsewhere, Paris moved up modestly from 1,640 to 1,810, and Singapore barely changed, at 1,050 and 1,090. The net effect was that the gap between the busiest and quietest markets narrowed from 3,250 homes to 2,620.
| swapped places at the top | đổi ngôi cho nhau ở đầu bảng |
| suffered the largest fall | chịu mức giảm lớn nhất |
| took the lead | vươn lên dẫn đầu |
| proportionally steeper | giảm mạnh hơn nếu tính theo tỉ lệ |
| narrowly ahead of | nhỉnh hơn một chút so với |
| recorded a substantial rise | ghi nhận mức tăng đáng kể |
| barely changed | hầu như không đổi |