Bar chart — Frequency of internet use, 2006-2010
📄 Bài mẫu band 8–9
| Introduction | Paraphrase: mức độ thường xuyên dùng internet của người trưởng thành ở một nước châu Âu, từng năm 2006–2010, chia bốn nhóm. |
| Overview | Overall: dùng hằng ngày tăng mạnh thành nhóm lớn nhất, nhóm không bao giờ dùng co lại rõ; hai nhóm dùng thưa luôn là thiểu số và ngày càng ít đi. Không số liệu. |
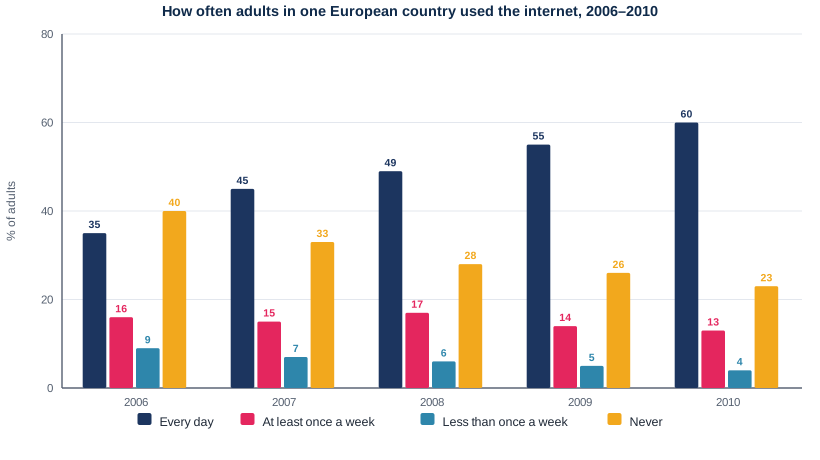
| Body 1 | 2006: Never 40%, Every day 35% (kém 5 điểm). 2007 đổi ngôi: 45% và 33%. 2010: Every day 60% (ba trên năm người), Never 23%, chưa bằng một nửa. |
| Body 2 | At least once a week: 16% → đỉnh 17% (2008) → 13%. Less than once a week: 9% → 4%, giảm hơn một nửa. Gộp hai nhóm: 25% (2006) → 17% (2010). |
The bar chart illustrates how frequently adults in a European country went online from 2006 to 2010, in four categories of use.
Overall, daily use grew strongly and became by far the most common pattern, whereas the share of adults who never used the internet shrank considerably. People who went online only weekly or less often remained a minority throughout, and a declining one.
In 2006, non-users formed the largest group at 40% of adults, five percentage points ahead of daily users. The two swapped places the following year, when daily use jumped to 45% and the proportion of non-users dropped to 33%. The share of daily users then rose year on year to reach 60% in 2010, the equivalent of three in five adults, while that of non-users declined more slowly to 23%, less than half that figure.
The remaining categories were far smaller. The proportion of adults who went online at least once a week fluctuated within a narrow range, from 16% in 2006 to a high of 17% in 2008 before slipping to 13% in 2010. The share using the internet less than once a week dwindled steadily from 9% to 4%. Together, these two groups accounted for a quarter of adults in 2006 but only 17% in 2010.
| shrank considerably | co lại đáng kể |
| swapped places | đổi vị trí cho nhau |
| rose year on year | tăng đều qua từng năm |
| the equivalent of three in five | tương đương ba trên năm (người) |
| fluctuated within a narrow range | dao động trong biên độ hẹp |
| dwindled steadily | giảm dần đều |