Bar chart — Government spending on roads and transport in four countries, 1990-2005
📄 Bài mẫu band 8–9
| Introduction | Paraphrase: tỉ trọng ngân sách chính phủ dành cho đường sá và giao thông ở Italy, Portugal, UK, USA tại bốn mốc cách nhau năm năm, 1990–2005. |
| Overview | Overall: Italy và Portugal luôn dành tỉ trọng lớn hơn hẳn dù giảm dần; USA là nước duy nhất kết thúc cao hơn lúc đầu, còn UK dao động và kết thúc thấp nhất. Không số liệu. |
| Body 1 | Portugal: 27,1% → 20,1%, giảm đều qua cả bốn mốc (mất 7 điểm). Italy: 22,4 → 19,2%, phần lớn mức giảm xảy ra trước 2000. Khoảng cách hai nước thu từ 4,7 điểm xuống dưới 1 điểm. |
| Body 2 | UK 10,3% và USA 11,2% năm 1990, cùng giảm khoảng 1 điểm năm 1995, cùng lên 12,7% và 13,6% năm 2000; sau đó USA lên 15,3% còn UK tụt về 8,4% (thấp nhất hình) — USA gần gấp đôi UK. |
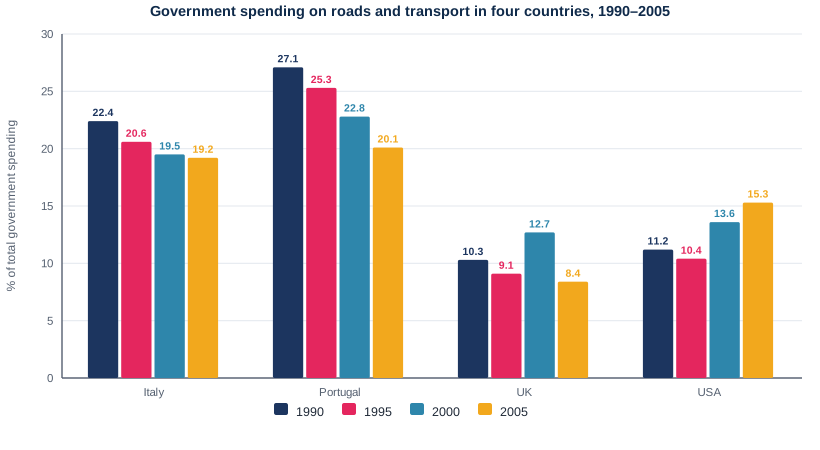
The bar chart shows what share of total government expenditure Italy, Portugal, the UK and the USA devoted to roads and transport at five-year intervals between 1990 and 2005.
Overall, Italy and Portugal consistently allocated a far larger proportion of public money to this sector than the other two nations, although their figures fell throughout. Only the USA devoted a larger share to it at the end of the period than at the start, while the UK's figure fluctuated and ended lowest of all.
Portugal's share, the highest in all four years, fell steadily from 27.1% in 1990 to 20.1% in 2005, a drop of seven percentage points. Italy's decline was gentler, from 22.4% to 19.2%, and most of it occurred before 2000. As a result, the gap between the two shrank from 4.7 points to less than one.
The UK and the USA started much lower, at 10.3% and 11.2% respectively, and at first moved in step: both dipped by about a point in 1995 before climbing to 12.7% and 13.6% in 2000. Thereafter their paths diverged. The American figure carried on rising to 15.3%, whereas the British one slumped to 8.4%, the lowest reading on the chart. By 2005, therefore, the American share was not far short of double the British one.
| at five-year intervals | cách nhau mỗi năm năm |
| allocated a far larger proportion | phân bổ một tỉ trọng lớn hơn hẳn |
| fell steadily | giảm đều |
| moved in step | biến động cùng nhịp với nhau |
| their paths diverged | hai đường đi tách hướng |
| the lowest reading on | mức thấp nhất trên (biểu đồ) |