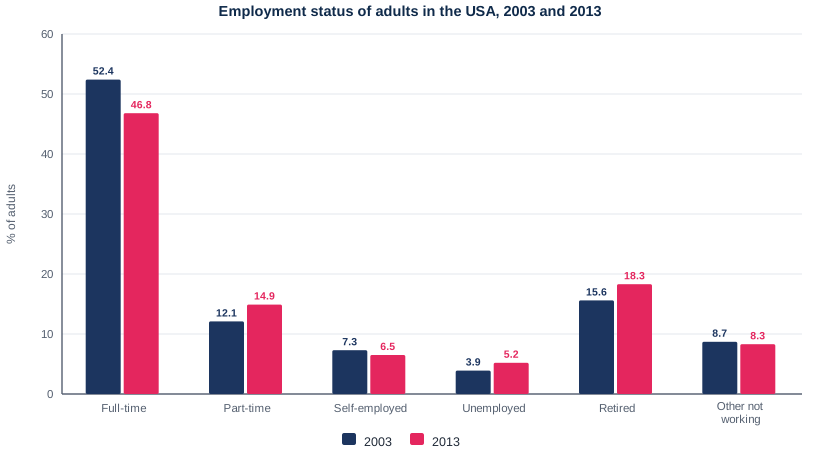
Bar chart — Employment status of adults in the USA, 2003 and 2013
📄 Bài mẫu band 8–9
| Introduction | Paraphrase: biểu đồ cột chia người trưởng thành ở Mỹ theo sáu tình trạng việc làm, năm 2003 và 2013, tính bằng phần trăm. |
| Overview | Overall: full-time luôn là nhóm đông nhất dù thu hẹp; xu hướng dịch chuyển từ full-time và tự doanh sang part-time, nghỉ hưu, thất nghiệp. Không số liệu. |
| Body 1 | Full-time 52.4% → 46.8% (giảm 5.6 điểm phần trăm); part-time 12.1% → 14.9%; self-employed 7.3% → 6.5%; cộng ba nhóm đi làm: 71.8% → 68.2%. |
| Body 2 | Retired 15.6% → 18.3% (nhóm lớn thứ hai); unemployed 3.9% → 5.2% (nhỏ nhất, tăng một phần ba); other not working 8.7% → 8.3%, gần như đứng yên. |
The bar chart breaks down the adult population of the USA by employment status in 2003 and 2013, with each of six categories expressed as a percentage.
Overall, full-time work was by far the most common status in both years, although its share shrank noticeably. Over the decade there was a shift away from full-time jobs and self-employment towards part-time work, retirement and unemployment.
In 2003, just over half of American adults (52.4%) were in full-time employment, but this figure had dropped by 5.6 percentage points to 46.8% ten years later. Part-time work moved in the opposite direction, rising from 12.1% to 14.9%, so that roughly one adult in seven was employed on this basis by 2013. The self-employed formed a much smaller group, and their share slipped slightly from 7.3% to 6.5%. Taken together, the three working categories accounted for 71.8% of adults in 2003 but only 68.2% in 2013.
Among those not working, retired people were the largest group, and the second largest overall, growing from 15.6% to 18.3% of adults. The unemployed made up the smallest category in both years; even so, their proportion climbed from 3.9% to 5.2%, an increase of a third in relative terms. The remaining category, other adults not working, was virtually unchanged, at 8.7% and 8.3% respectively.
| by far the most common | phổ biến nhất, bỏ xa các nhóm khác |
| were in full-time employment | đang làm việc toàn thời gian |
| slipped slightly | giảm nhẹ |
| Taken together | gộp chung lại |
| made up the smallest category | là nhóm nhỏ nhất |
| in relative terms | xét theo tỉ lệ tương đối |
| was virtually unchanged | gần như không đổi |