Bar chart — Employment in three sectors in four countries, 1980 and 2010
📄 Bài mẫu band 8–9
| Introduction | Paraphrase: cơ cấu lao động theo ba khu vực (agriculture, industry, services) của Japan, Brazil, China, India năm 1980 và 2010. |
| Overview | Overall: cả bốn nước chuyển lao động từ nông nghiệp sang dịch vụ; nhưng chỉ Japan và Brazil có dịch vụ đứng đầu, còn ở China và India nông nghiệp vẫn là khu vực lớn nhất. Không số liệu. |
| Body 1 | Japan và Brazil: services 54% → 70% và 46% → 62% (cùng tăng đúng 16 điểm); agriculture Japan 11% → 4%, Brazil 30% → 16%; industry Japan 35% → 26%, Brazil 24% → 22%. |
| Body 2 | China: agriculture 68% → 37%, services 14% → 34% (chỉ kém nông nghiệp 3 điểm), industry 18% → 29%. India: agriculture 69% → 52%, industry 14% → 22%, services 17% → 26%. |
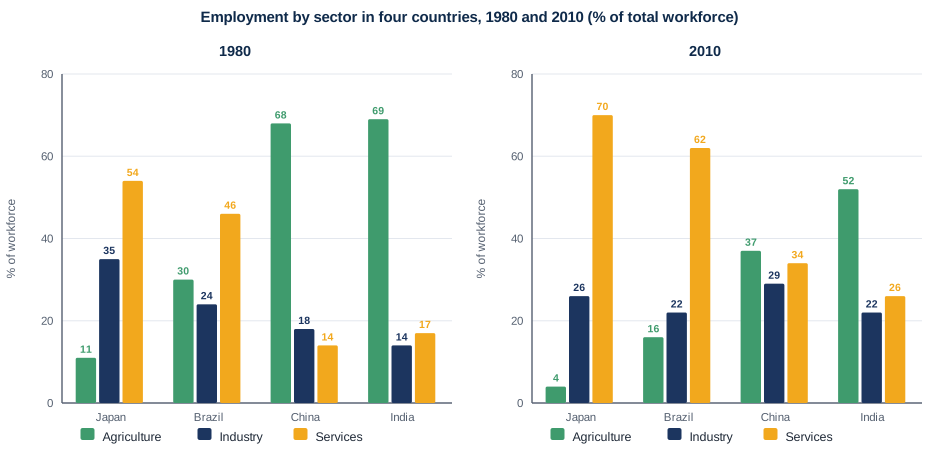
The two bar charts compare how the labour forces of Japan, Brazil, China and India were divided among agriculture, industry and services in 1980 and 2010.
Overall, all four countries saw a shift away from farming and towards services. Even so, services were the dominant sector only in Japan and Brazil, whereas agriculture, despite shrinking, still employed the most workers in China and India.
Services were already the largest employer in Japan and Brazil in 1980, accounting for 54% and 46% of workers respectively, and both figures rose by exactly 16 percentage points to reach 70% and 62% by 2010. Agricultural employment in Japan shrank to a mere 4%, from 11%, and almost halved in Brazil, from 30% to 16%. Industry also contracted in both, notably in Japan (35% to 26%).
In China and India, by contrast, roughly two thirds of workers (68% and 69%) were on the land in 1980. China then underwent the more dramatic change: farming fell to 37%, while services more than doubled from 14% to 34%, leaving agriculture only three points ahead, and industry climbed from 18% to 29%. India's transition was slower. Agriculture still accounted for just over half of all jobs (52%) in 2010, although industry and services had each gained ground, rising to 22% and 26%.
| a shift away from | sự dịch chuyển rời khỏi |
| the largest employer | khu vực sử dụng nhiều lao động nhất |
| shrank to a mere | co lại chỉ còn vỏn vẹn |
| underwent the more dramatic change | trải qua thay đổi mạnh hơn (trong hai nước) |
| more than doubled | tăng hơn gấp đôi |
| accounted for just over half | chiếm hơn một nửa một chút |
| gained ground | tăng tỉ trọng, lấn lên |