Bar chart — Daily oil production in four countries
📄 Bài mẫu band 8–9
| Introduction | Paraphrase: sản lượng dầu mỗi ngày (triệu thùng) của Saudi Arabia, the USA, Russia và Nigeria ở bốn mốc cách nhau 5 năm, 2000–2015. |
| Overview | Ba nước sản xuất lớn đều tăng sản lượng sau 15 năm, the USA từ hạng hai lên dẫn đầu; Nigeria thấp hơn hẳn và hầu như không đổi. Không số liệu. |
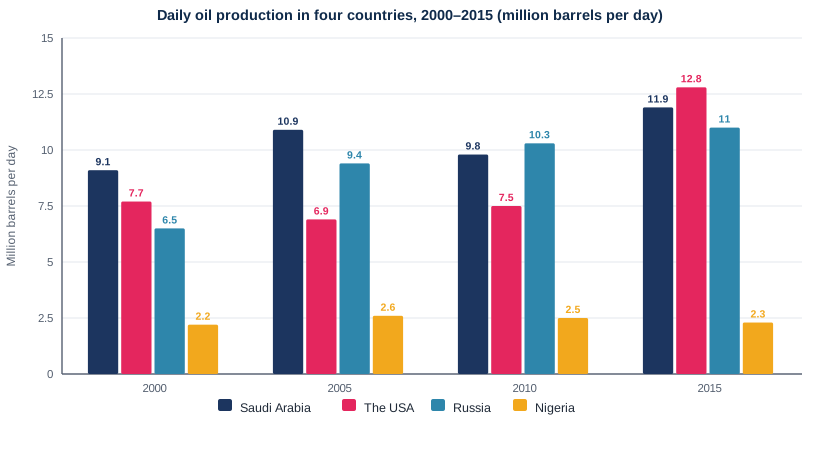
| Body 1 | Saudi Arabia: 9.1 → 10.9 (2005) → 9.8 (2010) → 11.9. The USA: 7.7 → 6.9 → 7.5 → vọt lên 12.8, cao nhất biểu đồ, hơn Saudi Arabia 0.9 triệu thùng. |
| Body 2 | Russia: 6.5 → 9.4 → 10.3 (dẫn đầu năm 2010) → 11.0, nước duy nhất tăng liên tục. Nigeria: dao động 2.2–2.6; năm 2015 mỗi nước còn lại sản xuất gấp khoảng 5 lần hoặc hơn. |
The bar chart compares daily oil output, in millions of barrels, in Saudi Arabia, the USA, Russia and Nigeria at five-year intervals from 2000 to 2015.
Overall, the three major producers were all pumping more oil at the end of the period than at the beginning, with the USA moving from second place to first. Nigeria, by contrast, lagged far behind throughout, and its output barely changed.
Saudi Arabia was the leading producer in 2000, at 9.1 million barrels a day. Its output climbed to 10.9 million in 2005, dipped to 9.8 million in 2010 and then recovered to 11.9 million. American production took a different course: it slipped from 7.7 million to 6.9 million barrels in 2005, was still only 7.5 million in 2010, and then surged to 12.8 million, the highest figure on the chart and 0.9 million above the Saudi total.
Russia was the only country to record uninterrupted growth. Starting at 6.5 million barrels, its output rose to 9.4 million in 2005 and 10.3 million in 2010, when it briefly topped the ranking, before reaching 11.0 million in 2015. Nigerian production, meanwhile, fluctuated within a narrow range of 2.2 to 2.6 million barrels, so by 2015 each of the other three was producing around five times as much, or more.
| lagged far behind | tụt lại rất xa phía sau |
| the leading producer | nước sản xuất dẫn đầu |
| dipped to | giảm nhẹ xuống mức |
| surged to | tăng vọt lên mức |
| uninterrupted growth | mức tăng liên tục, không gián đoạn |
| topped the ranking | đứng đầu bảng xếp hạng |
| fluctuated within a narrow range | dao động trong một biên độ hẹp |